I am working on some CFD postprocessing and we to visualize flow better, we use something called a Line Integral Convolution aka LIC which is super useful to see some properties of the flow.
I would be trying to automate some of the work which I usually do by eye and I think that opencv could be useful.
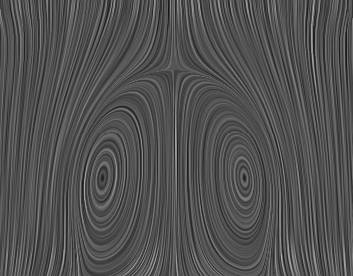
As shown in the picture attached, it would be helpful to recognize the center of the following features, which are basically flow lines, but for me it would be interesting to spot the point where that thing becomes a circle…
Is there a good way to do it? Is it even possible with opencv? Are there some examples?
that picture with flow lines is not “data”, it’s visualization. you have the field data, which should be a 2D vector per pixel, right? work with that. those points probably have some easy to locate properties (whatever-order gradient is zero).
anything that can calculate on arrays (opencv, numpy, scikit-image, scikit-*), would help.
Not really, I would have some kind of field data if extracted from such pictures as we can’t access the array of data of the LIC. LIC is very much needed as at this point and for my application is one of the only reliable way to even see these centers.
Gradients aren’t exactly easy to spot in the original field data as we are mostly working with data of very different intensity and putting thresholds on the field data is quite tricky as you have to adjust them for each “2D region” both in XY and XZ in order to even see something…
LIC produces always pictures similar to that one, even if the intensity is different,
and since by eye you can look at the circles and fit a circle around the center, I was wondering if starting from these kind of pictures one could apply something similar to the Hough Circle transformation to do the same automatically
I looked at the file. that is the LIC visualization. I was asking for the vector field data (2D vector per pixel?) from which the visualization was generated.
Hough circles won’t work on this image.
Try some kind of gradient analysis, local structure tensor fields (article), gradient convergence indicators/symmetry transform(article), or even Gabor filters/circular Gabor filters (article).