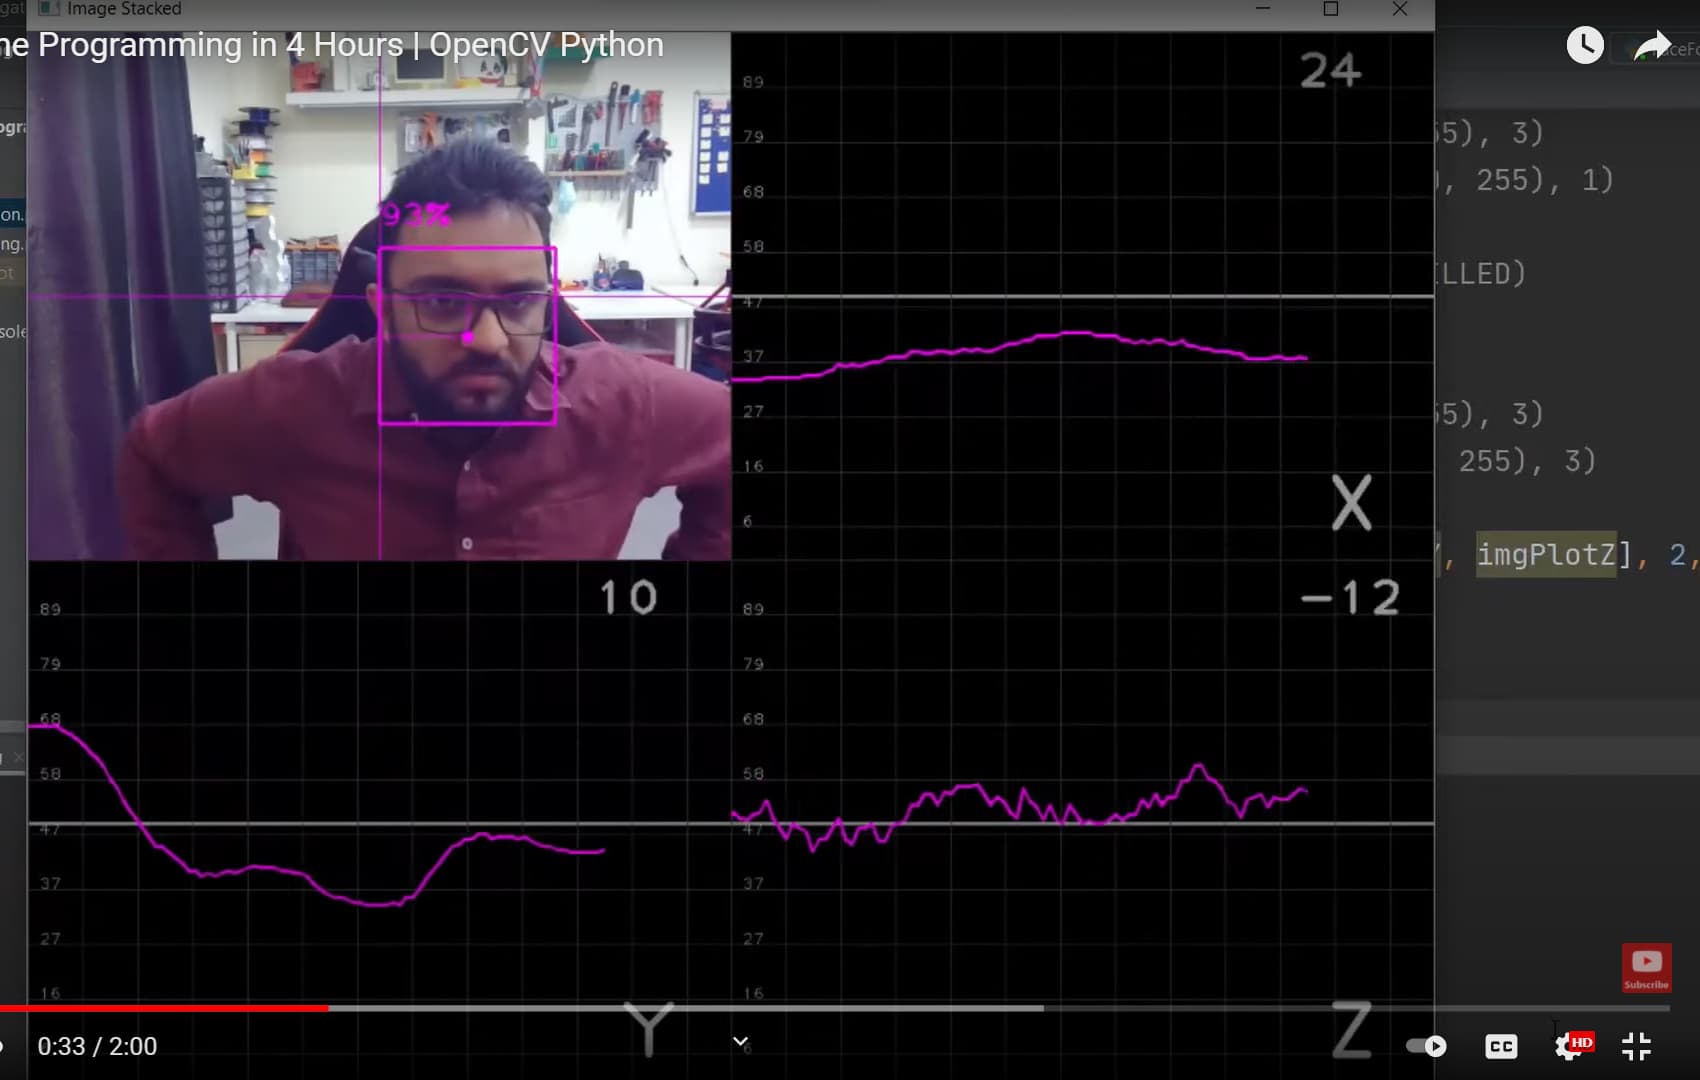
Here I attached one image to showcase what I really want. How can I plot this real-time x, y, z graph in OpenCV or in any other library?
i think, you’re asking in the wrong place,
we cannot help with aritrary python problems
(and opencv does not have this functionality)
That is yet more content by Murtaza. I have misgivings about his content (“cvzone”) and his fanbase.
if you have questions about his content, ask him.
if you’re looking to plot something from python… you would find many recommendations on the internet already.
by the way: OpenCV does have some rudimentary plotting functionality. that is maybe used here. you’ll find it if you just google for it… or he has custom drawing code.